Economic Outlook: Source
The IRS said it’s issuing bigger tax refunds compared with a year earlier, signaling a potential boon for Americans who rely on their annual refund to help with debt or purchases. This is great news for automotive retailers.
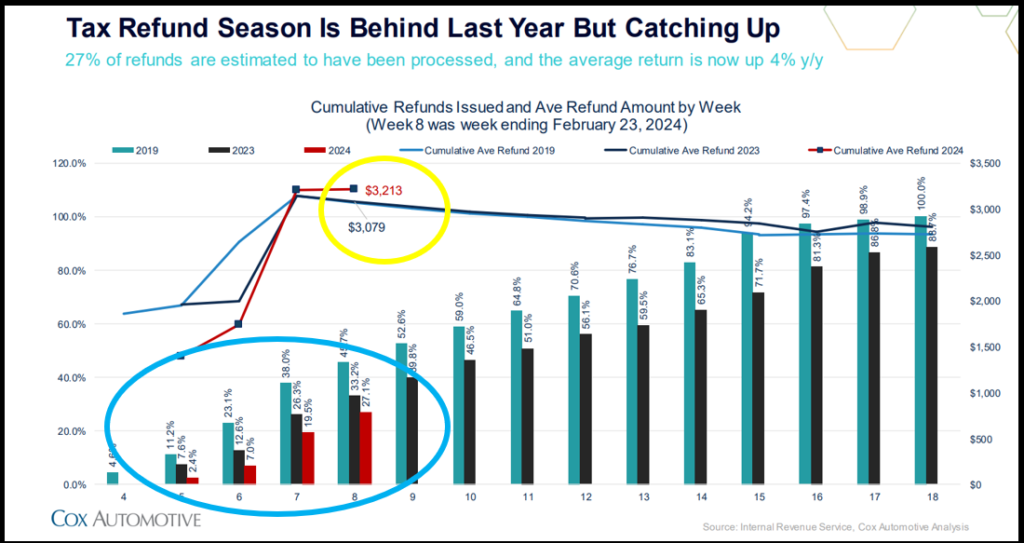
Here are the specifics of our current filing pace:
- Seven weeks are remaining in the current tax season, which means that the data could fluctuate until the IRS stops accepting tax returns on April 15. (Tax filers can also ask for an automatic extension, which gives them until October 15 to file their tax forms.)
- So far, about 34.7 million people have filed tax returns, a fraction of the 146 million individual tax returns that the IRS expects this year.
New and Used Retail Sales and Day Supply Trending: Source
The new and used retail sales activity in the first nine weeks of the year is very encouraging heading into the height of tax season. That’s having an impact on day supply which will keep the acquisition cost of used high most likely through mid-April. Having a balanced acquisition strategy between now and then is critical to keep from overpaying for inventory in this needs-demand-driven market.


Manheim Wholesales Market Source
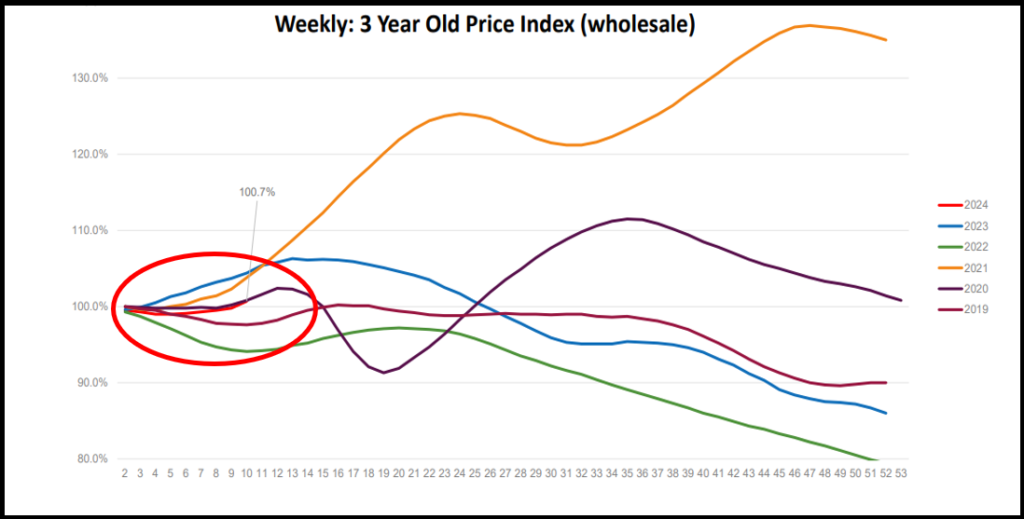
The Spring wholesale market is officially here. Three-year-old wholesale values increased 0.9% (all age vehicles increased week over week), lane efficiency increased 4% – 6% pts, and sale prices are in line with MMR. Used retail sales still strong compared to most previous years and days’ supply is lower than average. New car days’ supply generally increases as inventory grows.
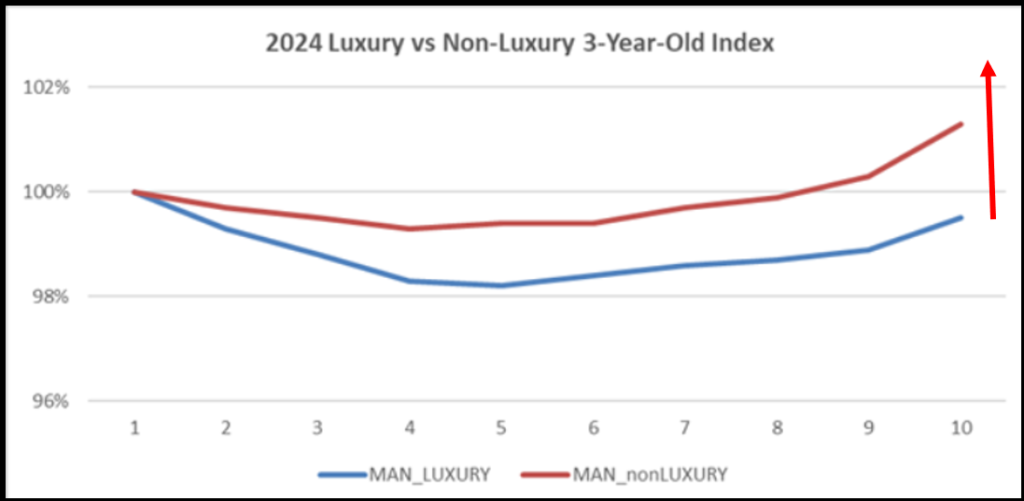
- The 3-year-old index increased at a notable rate, moving up 0.9% to 100.7%. Luxury increased 0.6% and non-luxury increased 1.0%.
- Wholesale values increased for all age vehicles; older model years continue to increase the most.
- Sale prices almost at MMR (-0.09%).
- Lane efficiency increased 4 – 6% pts week over week and is in line with 2023 levels.
- Retail prices dropped some last week, and spreads continue to drop due to stabilizing wholesale values and dropping retail prices, though non-luxury retail prices are starting to plateau.
- The used retail sales rate continues its strength despite lower inventory levels. At 33 days, the days’ supply is lower than most previous years.
- New car sales continue to trend higher than some previous years, but inventory also continues to build. Days’ supply dropped to 58 at February month end.

Black Book: Source
- The car market exhibited a continued slowdown in depreciation with an overall decrease of -0.10%, much less than the previous week’s drop of -0.25%.
- The Compact Car segment stood out with a significant +0.41% increase, which is its largest gain since mid-April 2023.
- The Truck segment experienced a marginal increase in overall depreciation at -0.18%, despite the Minivan category’s growth and the Small Pickup’s consistent rise.
- Luxury segments, notably Compact Luxury Crossover/SUVs, saw substantial declines, highlighting the mixed performance across vehicle categories.
Vehicle Acquisition Values & Trends:
1- to 10-year-old vehicles are growing in appreciation each week with week 9 showing growth of over 1% for 4- to 10-year-old vehicles which are in the highest demand category during tax season. You can see that below in the gray and orange line.
Every model year is growing i value by the percentage you see below. The 9 year old affordable vehicle is growing the fastest at almost 2% week over week in acquisition cost.
Manheim Wholesales to Retail Trending: Source
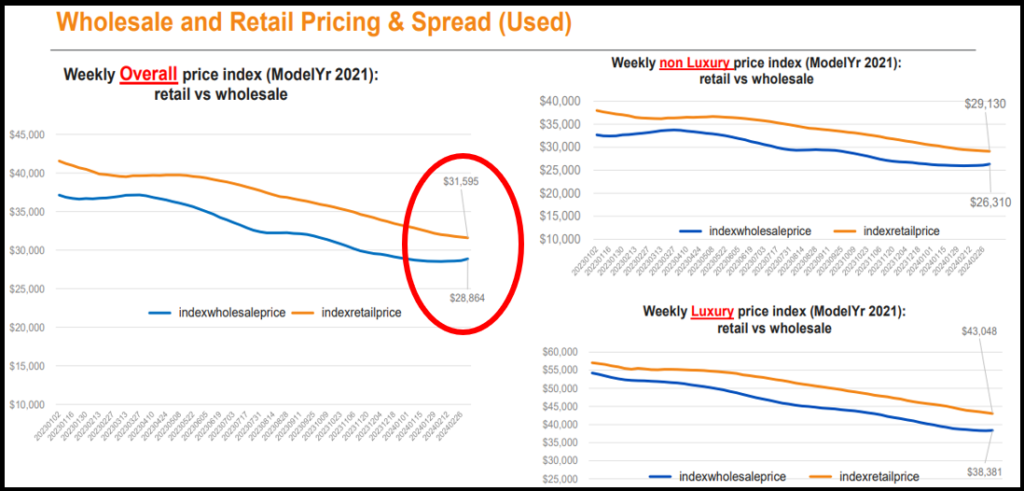
The acquisition value of inventory and the three-year old model year category is growing rapidly weaker over a week now showing a margin spread just shy of $3000. It’s been losing hundreds of dollars each week and will continue to do that most likely for the next couple of weeks until the retail price starts to move back towards a balanced wholesale trend. You can see below that the orange line is beginning to do that inweek nine.
Black Book: Source
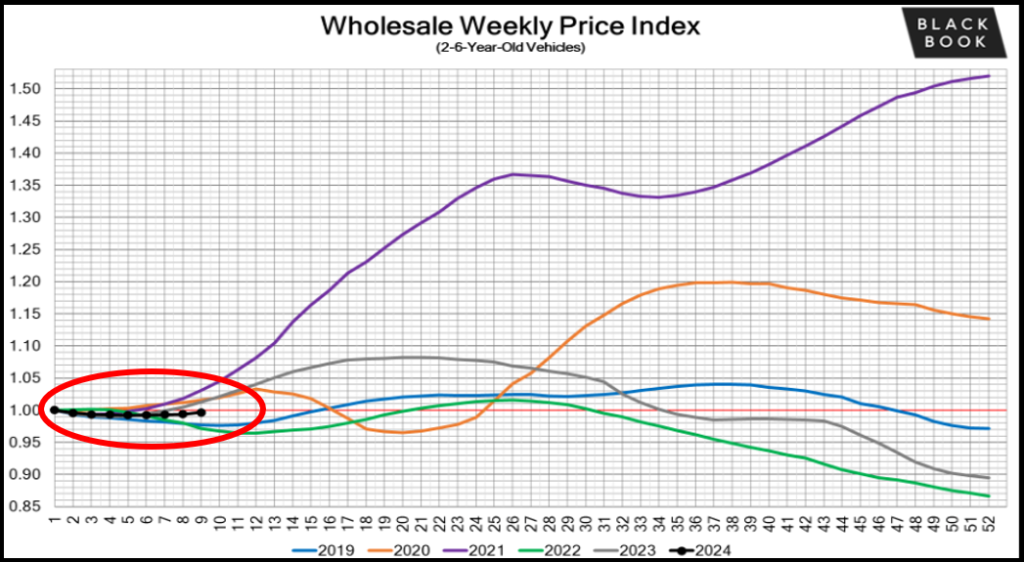
The 2- to 6-year-old inventory valuations in the retail sales side of the business is starting to grow because that’s the highest inventory in demand during the tax season. It’s in high demand because it’s the lowest retail price point inventory with this sample set of inventories between two- and six-year-olds being heavily weighted to the five- and six-year-old model years.
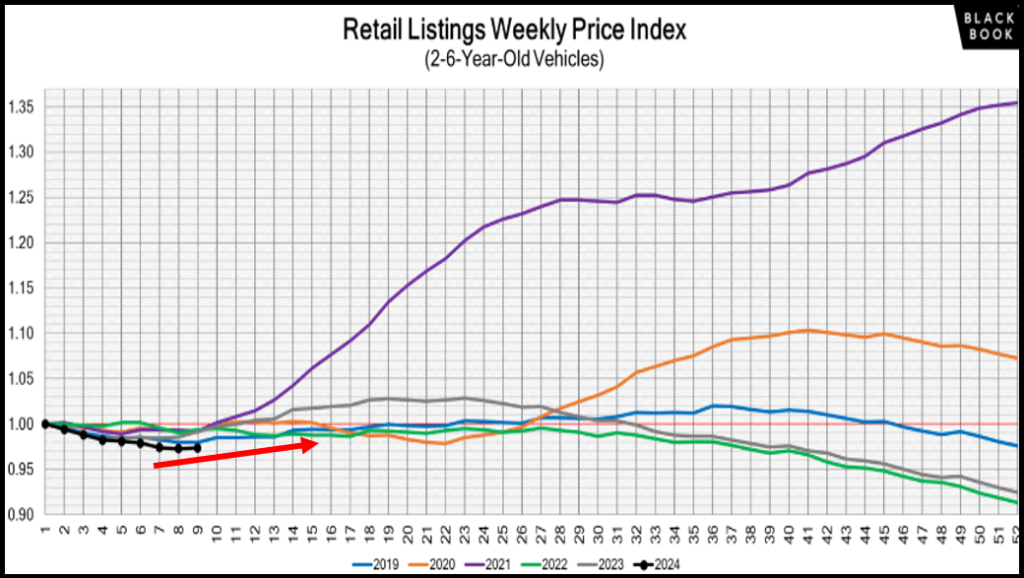
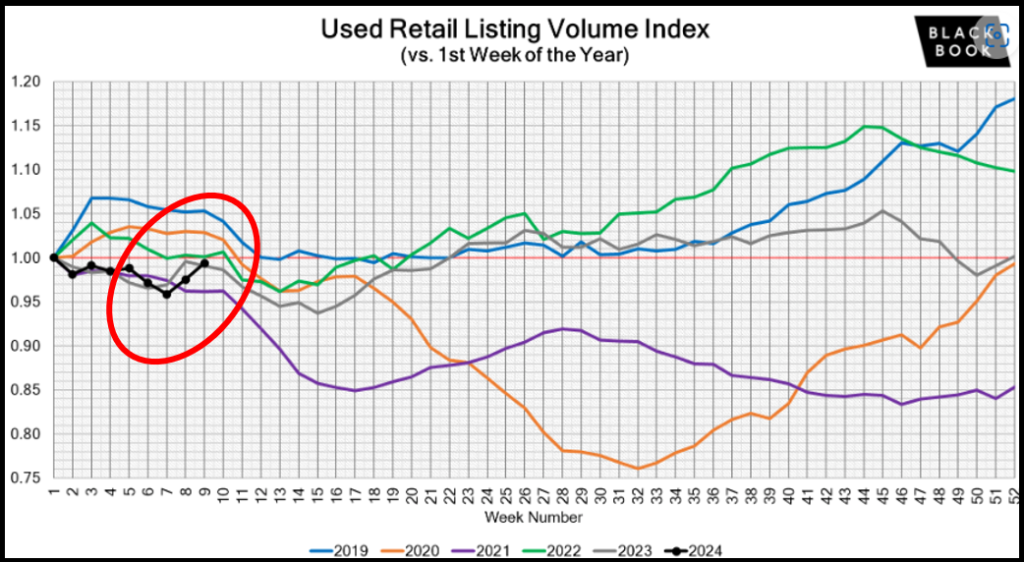
Dealers are filling their lot with inventory and preparation for the height of tax season and in anticipation of rising acquisition costs, the available listings on third parties and dealer lots are growing as well as shown in the black dotted line below. That brings cautionary flags to the pivot at the end of tax season being critical to predict. At The Automotive Advisor Team, we can help you do just that. Reach out for our guidance and forecasting metrics.
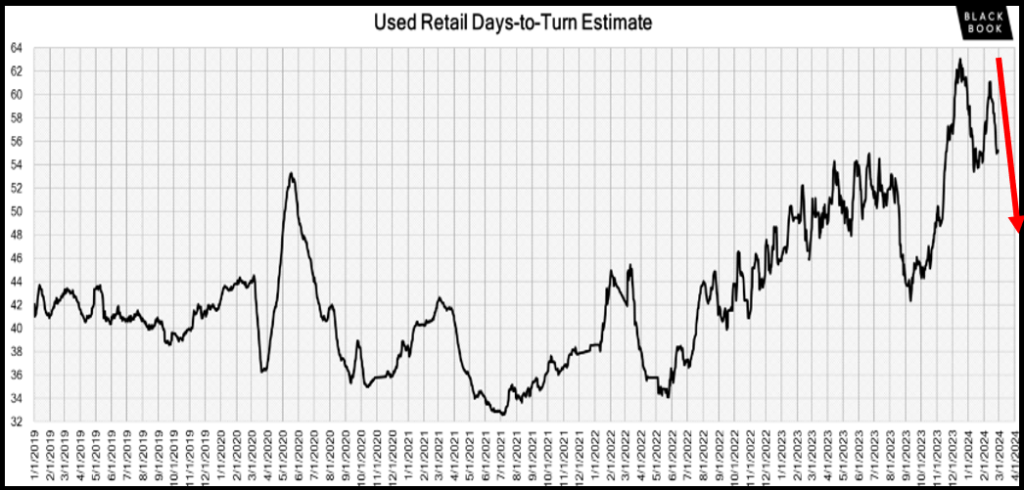
As with any tax season, the average days to turn are starting to decrease as well. At the height of 63 days in January, we’re now down to 55 days in early March. We can expect that trend to continue through the end of March. Benchmark your dealership’s average turn against that to see if you’re taking market share or losing market share. Our Used Car Optimizer program has that KPI built in for your dealerships if you are a dealer partner client.
Summary: Source
There’s no doubt we’re in the height of tax season and the value of inventory in the wholesale markets, along with the value given by your trade tools, are struggling to keep up with bank’s financing books. However, the inventory in the next few weeks, if not months, will continue to increase Buying the inventory you need now even though it feels like overpaying a little bit will be a much better strategy than waiting until you need the inventory. Then you will most likely have to pay 3 to 5% more for that same unit.
We’re not suggesting you go out and blanket buy inventory just because the price is rising. You want to always match your inventory acquisition to your rolling sales rate reviewed weekly, so you are always optimally leveraged and balanced with current market conditions. Understanding your dealership’s price band and segment strength based on your market’s demand is how you take market share and grow departmental gross in a margin-compressed market.


