Economic Outlook: Source
The current automotive tax season is about 3/4 of the way through and we’re finally catching up to our 2023 refund distribution averages. We’re currently 3% behind 2023 and 12% behind 2020 fours reef fund volume at this time in those years.
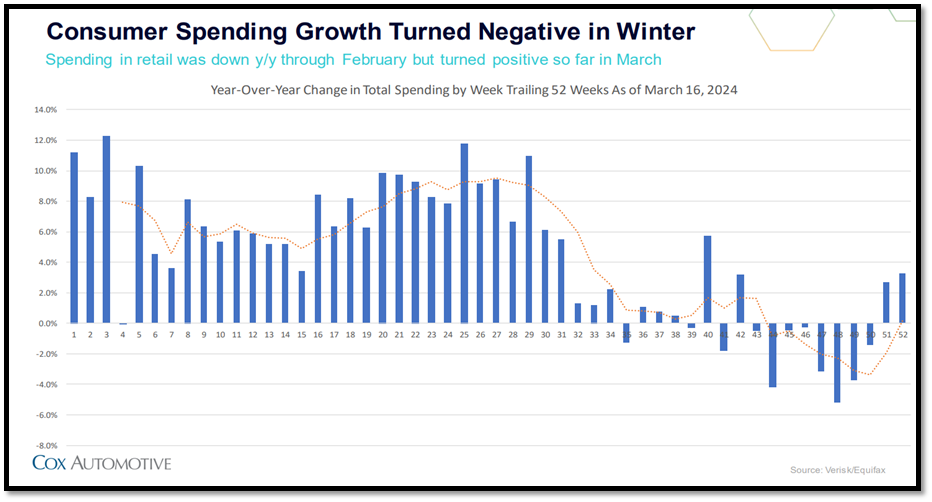
62% of refunds have been processed leaving 38% still pending for the last third of the tax refund season. That’s good news but the better news is that the tax refund amount is holding at about 5% higher year over year which means consumers have more money than expected to spend.
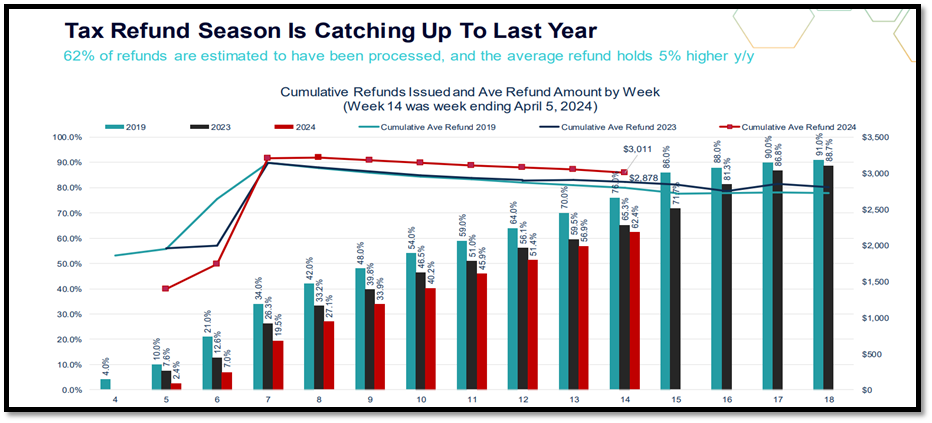
Down below that correlates into the consumer growth spending index turning positive at the end of last year and going into 2024 due to those anticipated tax refunds and the actual tax refunds. We can see that in our retail sales numbers later in the update.
Retail Sales and Supply Trending: Source
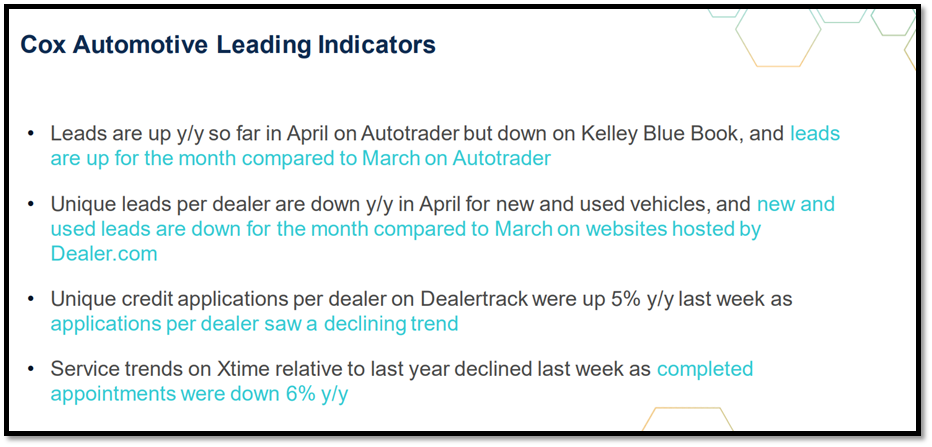
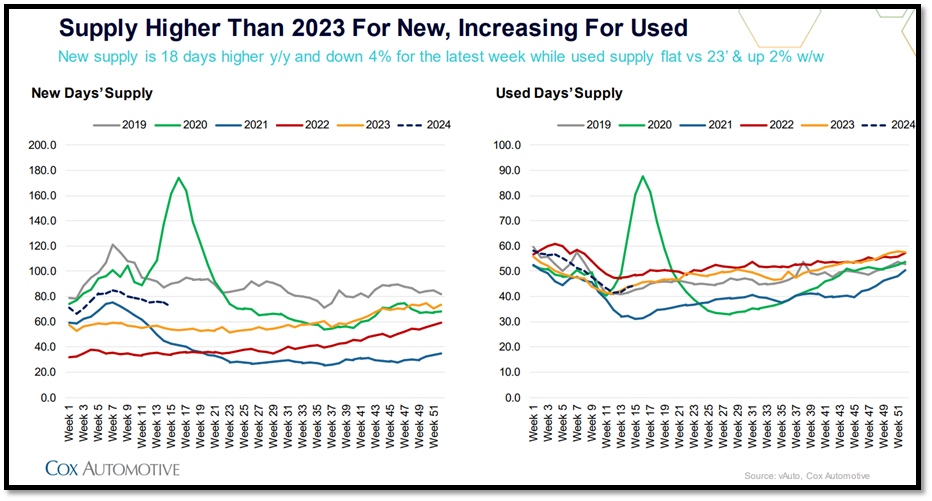
The retail sales for new cars increased in the last week 11% your year and they used car sales declined 2% week over week but still up 8% year over year. Many dealers felt that softening of used retail sales late last week and early this week.
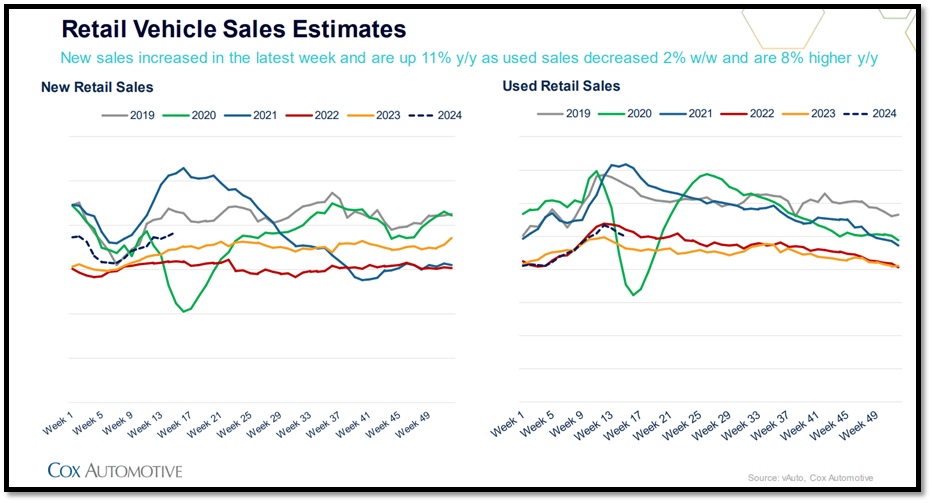
New supply is stable and softening sitting around 78 days but still 18 days higher than last year and used supply is flat year over year but up 2% in the last week due to those softening sales.
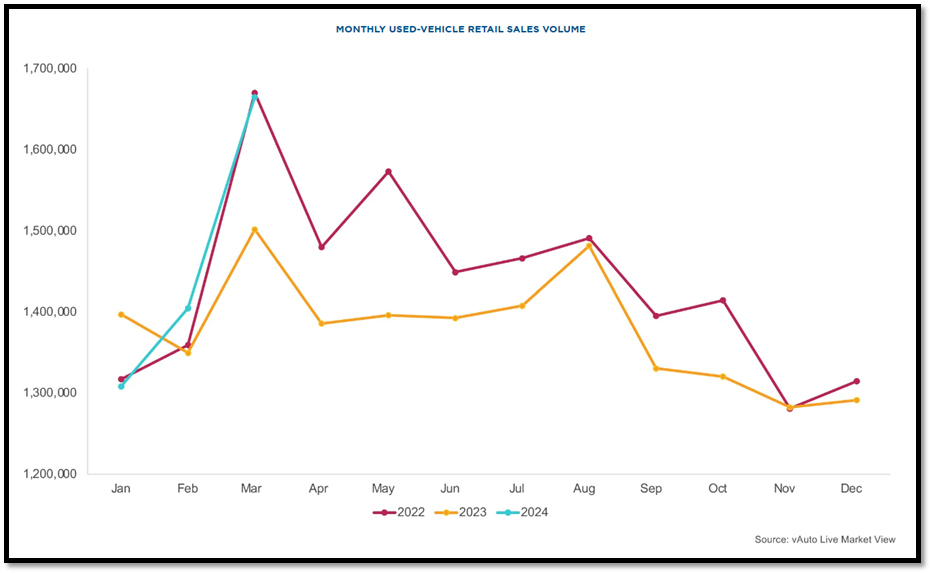
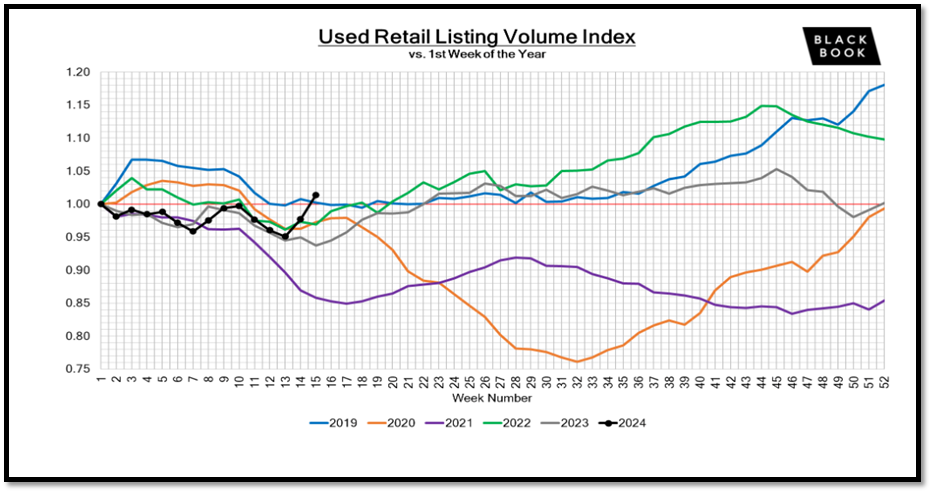
Used car vehicle sales grew significantly in March as you can see by the light blue access line below and following seasonal trends of 2023 and 2024 by softening in the first and second week of April. By mid-April we should see a shift back up to stronger youth car sales as shown below
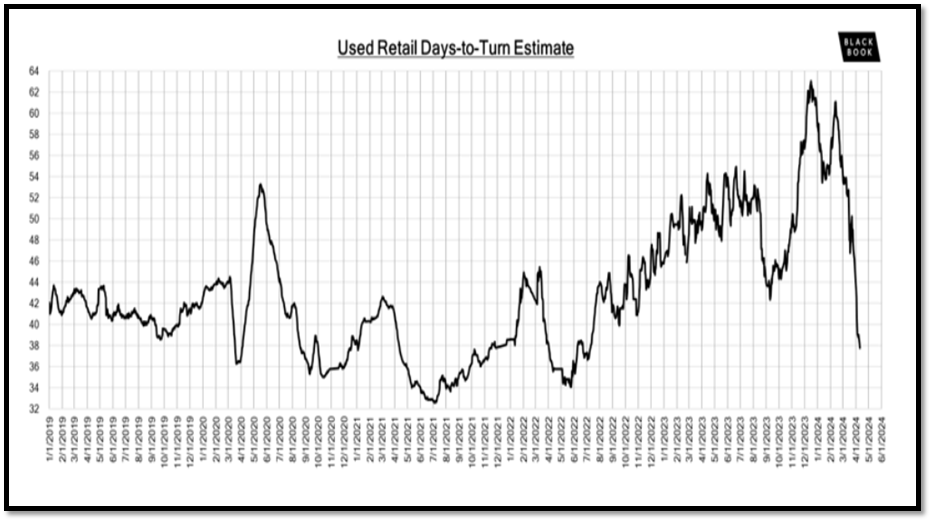
Used car retail turn is now below 40 days, sitting at about 37 1/2 days, contrasting from a height of 63 days at the end of last year. (Shown Below)
Cox Automotive’s Manheim Wholesales Market Source
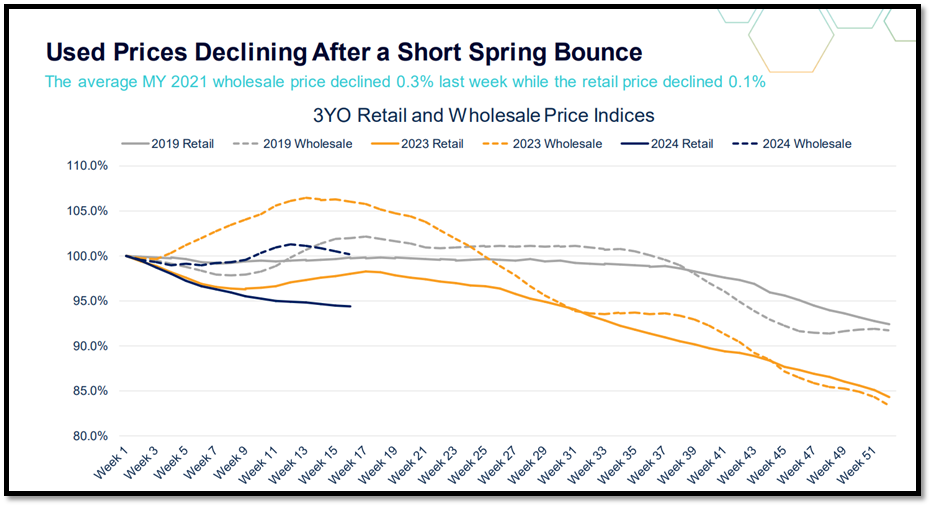
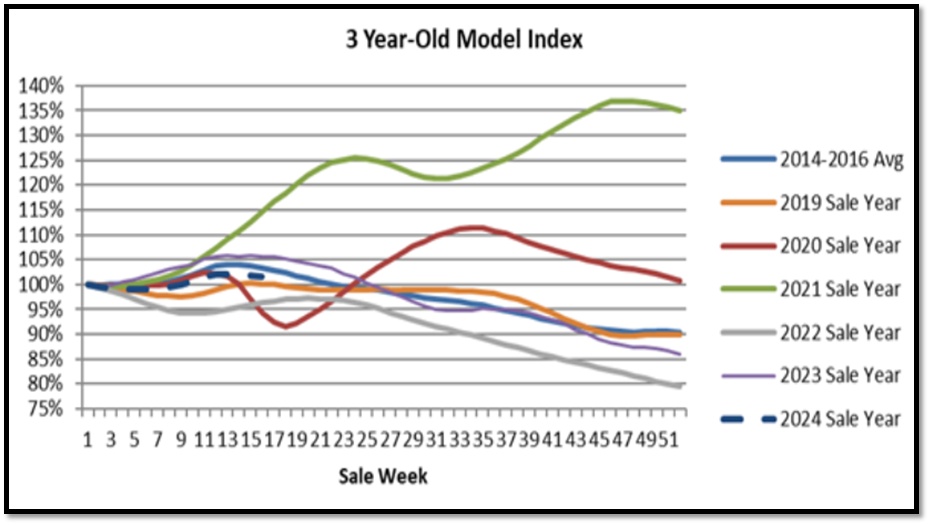
Used car retail prices are continuing to decline after a little bit of stabilization in weeks 11 through 13, Shown in the solid black line, but with the softening of the hostile prices and the dotted black line, the margins are still there. The key here is to turn your inventory faster. As you can see below, the benchmark value of a used vehicle that’s three years old has started to shift back to depreciating quickly, and that trend will most likely continue.

Black Book: Source
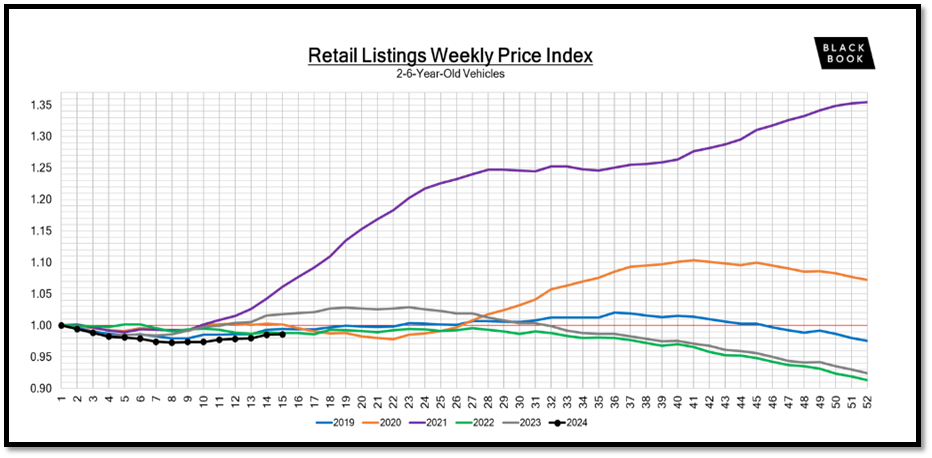
Contrast from Cox automotives three-year-old index black books 2- to 6-year-old the index is still showing an increase in valuations weaker over week for the cost of acquiring an older higher mileage smaller price point vehicle. This trend should also continue shown below in the dotted black line to mirror the solid blue line from 2019 below.

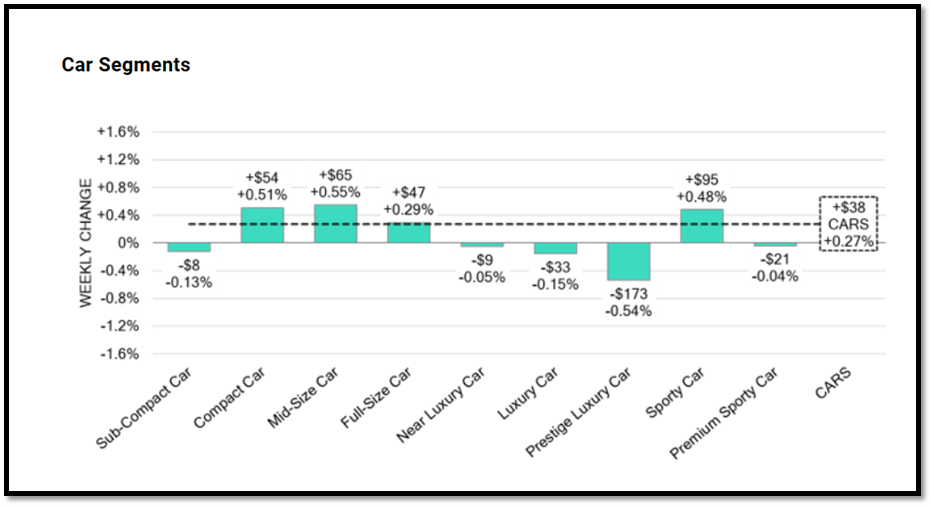
- In a volume-weighted basis, the overall Car segment increased +0.27%. For reference, in the previous week, cars increased +0.26%.
- The 0-to-2-year-old Car segments were up +0.25% and 8-to-16-year-old Cars increased +0.18%. Four of the nine Car segments increased last week.
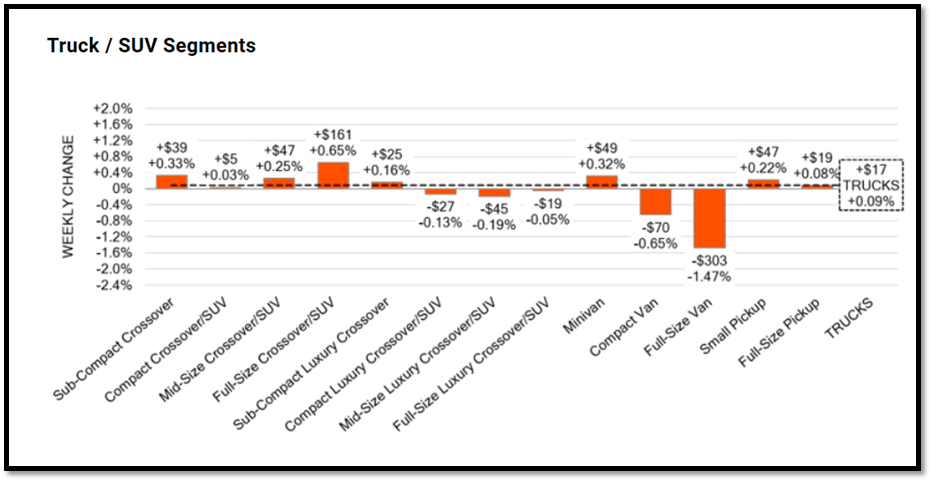
- The volume-weighted, overall Truck segment increased +0.09% compared to the appreciation seen the prior week of +0.23%.
- The 0-to-2-year-old models gained +0.06% on average and the 8-to-16-year-olds decreased by -0.03% on average. This was the first time in five weeks the 8-to-16-year-old Trucks reported a decline in values.
- Eight of the thirteen Truck segments increased last week.
Retail Margin Trending: Source
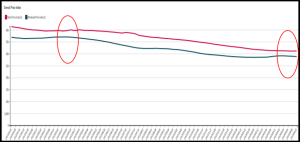
Down below in a year over year snapshot in the circle areas you can see that we’re starting to open up again in the retail versus wholesale cost of a vehicle where the retail staying flat and softening but the wholesale cost is softening faster. This is that four to six week lag we discuss year after year that’s opening up for margins again in the lower price points.
That is what the cop thought emotive listings price the black book two- to six-year-old model year listing price is also softening but not at the same rate. Shown below, it’s actually flattening and softening in a much less aggressive way due to these vehicles still being in high demand and turning faster on dealer lots.
This scenario shown below is troublesome. The black dotted line below shows that dealers had loaded up their lots from week 6 to week 9 in preparation for tax season and then took their foot off the accelerator from week 10 to week 13 as they were selling through their inventory during tax season. However the steep incline of acquisitions from week 13 to week 16 suggest that dealers got 2 lean and had to catch up the sales rate by but buying quickly. If that’s the case those dealers are not going to be in a good position in the next weeks and months. The used car optimizer tool would have guided these dealers correctly in their acquisition volume planning to continue to grow but avoiding any expensive risk that this scenario can cause.
Finance Market Trending: Source
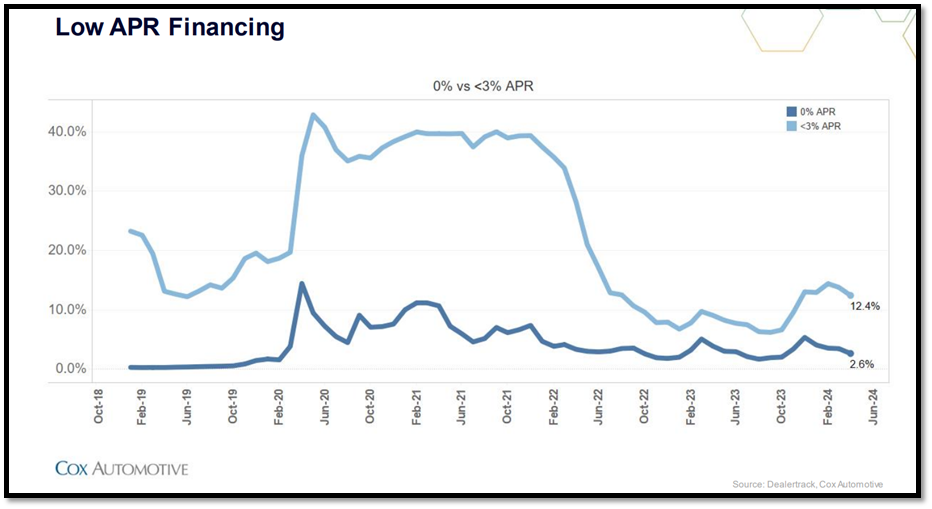
Percent of loans above APR about 3% or more are still at 12.4% but what’s more interesting is the percent of loans that are 0% APR are still almost 3%. These are on new car sales of course but it shows there’s still deals to be had in the market.
Auto loan rates are still at all-time highs, with used car auto rates as high as 14% with new car rates as high as 8% before incentives. The 10-year treasury and the Fed fund rates are well into the three and 3 1/2% range, the highest it’s been for quite some time. The possibility of interest pullbacks is less likely than anticipated early in the year, but one or two could still exist depending on inflation as we move into the second half.

Summary: Source