
Economic Outlook: Source
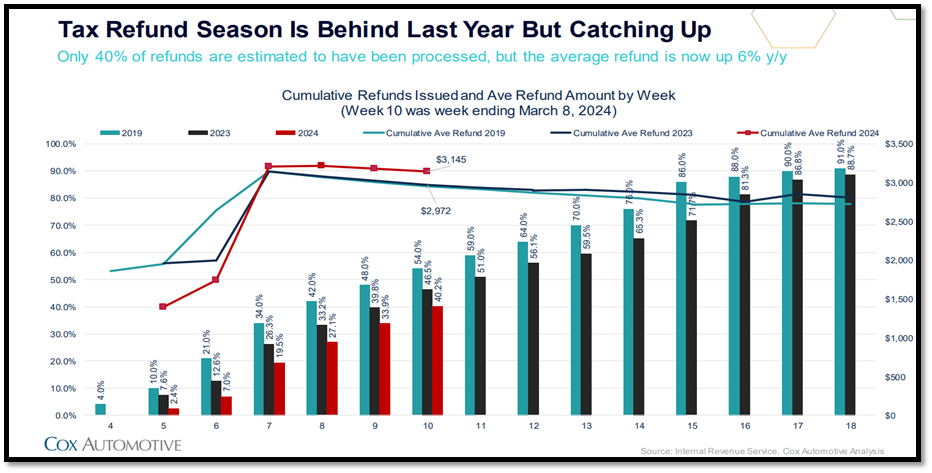
- The IRS reported that the average refund is now up 6.1% from $3,145, 1% higher than reported two weeks back.
- The IRS issued are down 13.8% from a year ago, creating a longer runway for dealers to see returns coming into the stores.
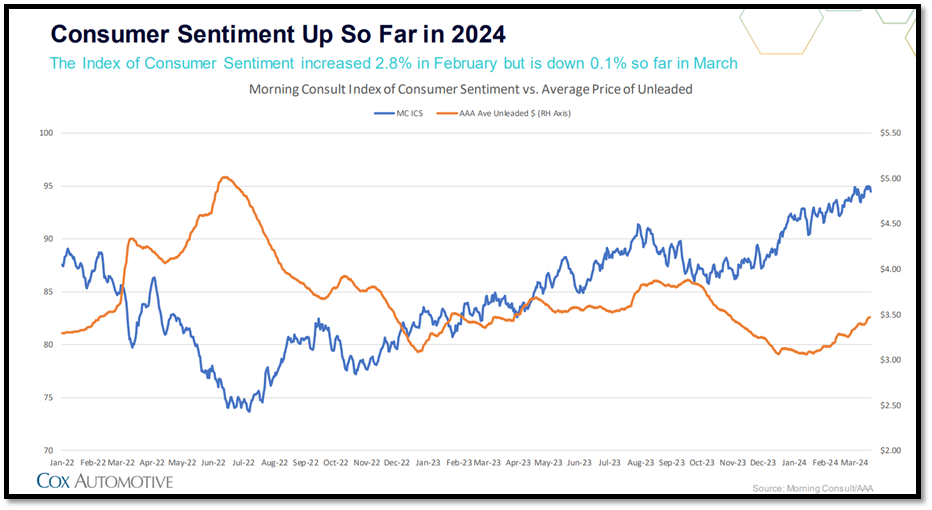
- More consumers are feeling optimistic about consumer sentiment at 95%, which is the highest it’s been since January of 2022 despite the uptick in gas prices.
New and Used Retail Sales and Day Supply Trending: Source
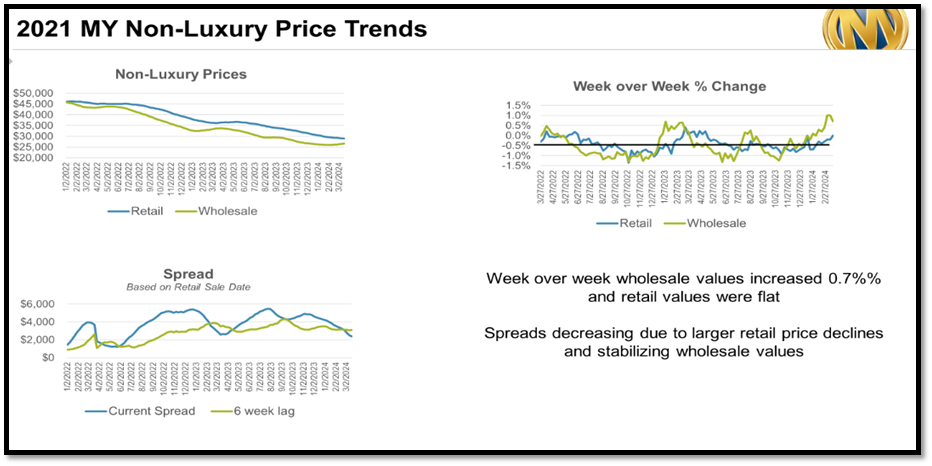
- Retail prices flat or decreasing very little. Spreads continue to drop due to increasing wholesale and flat or decreasing retail values.
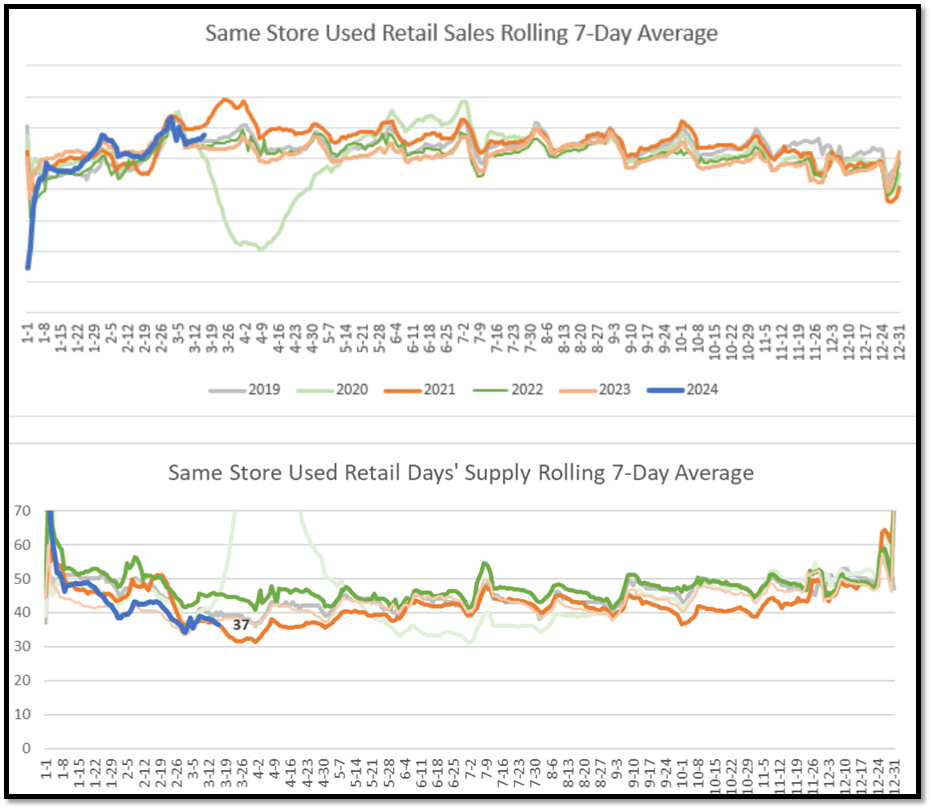
- The used retail sales rate increased again, running ahead of most previous weeks. Days’ supply still low at 37 days.
- New car sales trend is like 2019 but inventory also continues to build. Days’ supply moved down to 70 days.
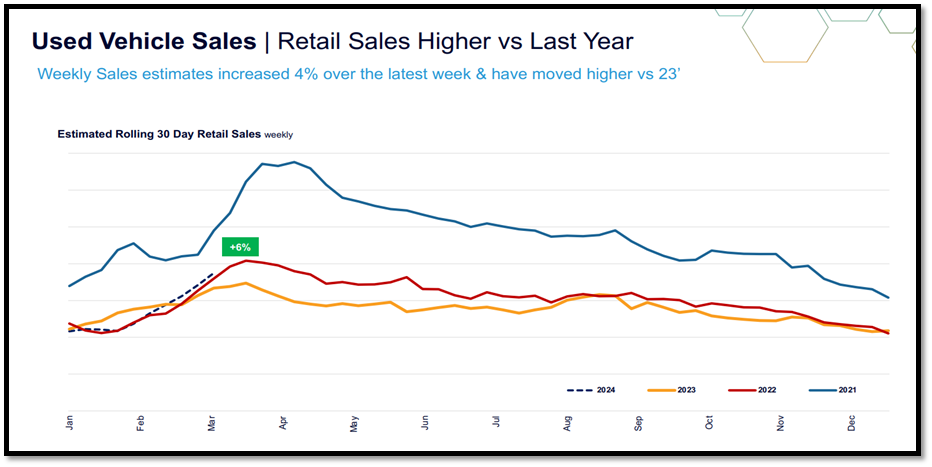
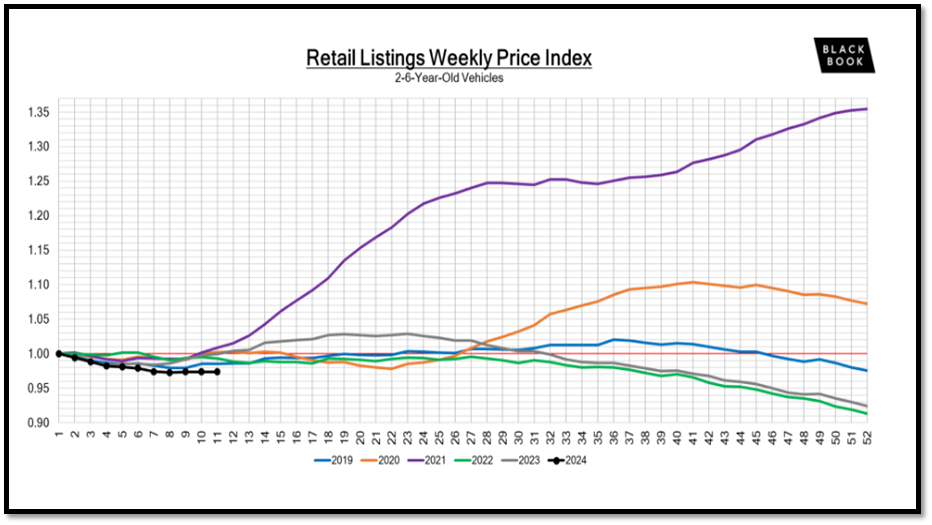
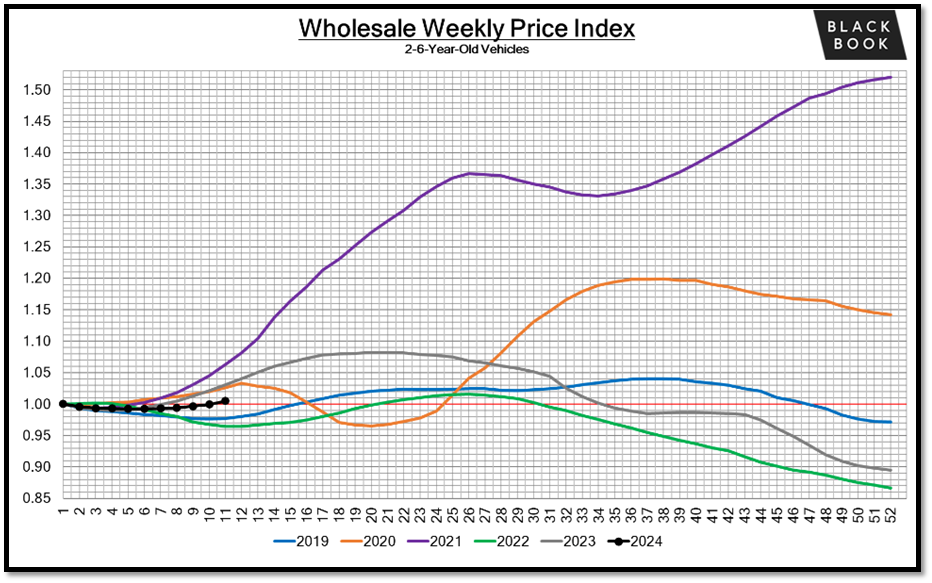
Below shows that 2024 used vehicle sales are pacing higher than 2022 in 2023 causing the day supply to drop week over week and is sitting in the low 30s in mid-March. That type of inventory availability should keep the average value of used inventory stable through the rest of the year. Below that you can see the retail listings price for two- to six-year-old model-year inventory from black book is increasing slightly week over week offsetting the margin compression created by the rising acquisition cost.
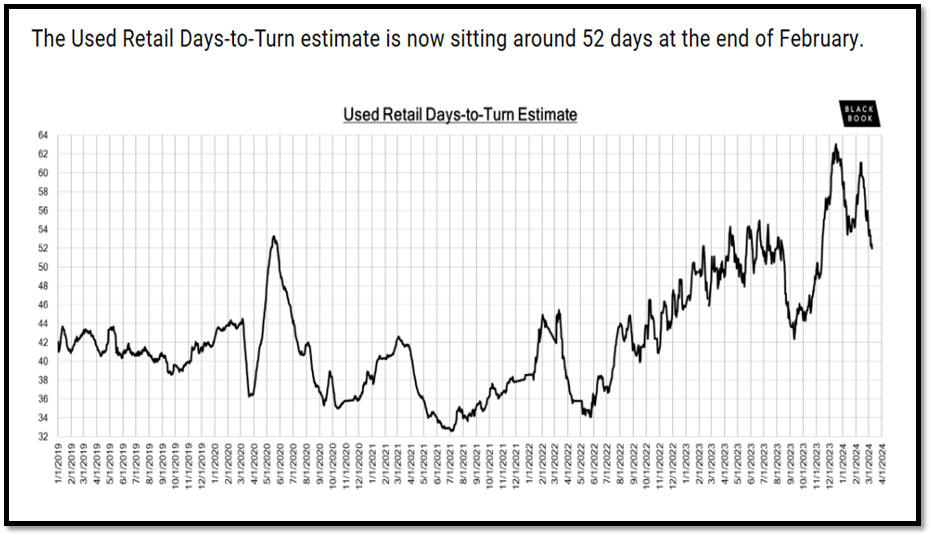
With dealers selling at a faster pace than in prior years, the amount of inventory listed on dealers’ lots below is decreasing slightly week over week, with the average days to turn down to 52 days from the high point of 63 days just a few weeks back.
Manheim Wholesales Market Source
The Spring wholesale market continues, but momentum is slowing. Three-year-old wholesale values increased 0.5% (+0.8% last week), lane efficiency flattened out and sale prices moved back below MMR. Used retail sales still strong compared to most previous years and days’ supply still relatively low. New car sales still trending higher than some previous years, but inventory continues to accumulate.
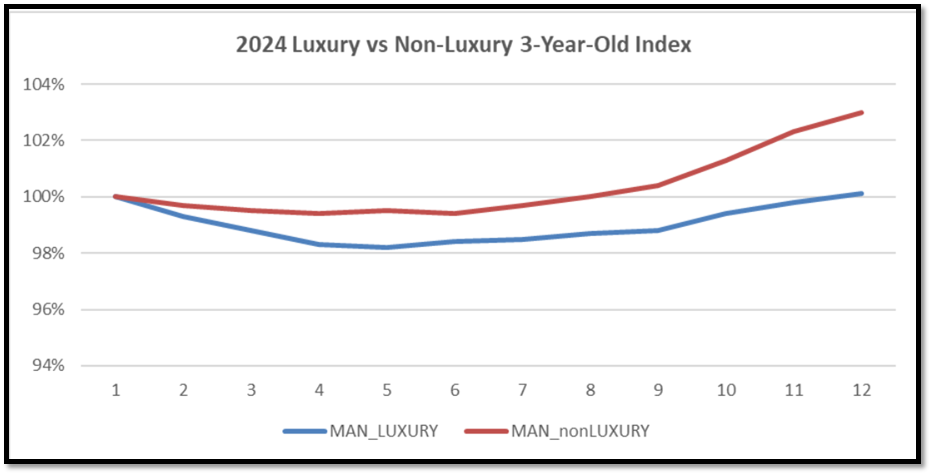
- The 3-year-old index moved up 0.5% to 102.0%. Luxury increased 0.3% and non-luxury increased.
- Wholesale values increased for most model years, but increases were smaller this week
- Sale prices moved back below MMR (-0.57%). Lane efficiency plateauing.
Black Book: Source
- The volume-weighted, overall Truck segment increased +0.24% compared to the depreciation seen the prior week of -0.02%.
- The 0-to-2-year-old models gained +0.09% on average and the 8-to-16-year-olds increased by +0.06% on average.
- Ten of the thirteen Truck segments increased last week.
- Although the broader Truck market saw growth, both the Mid-Size and Full-Size Luxury Truck segments experienced decreases last week, with declines of 0.05% and 0.40%, respectively.
- The Full-Size Pickup segment saw a modest increase of 0.06% last week, marking its first gain in forty weeks. This is a noteworthy change from the sharp depreciation experienced last November, when values declined over 2% in just one week.
Vehicle Acquisition Values & Trends: Source
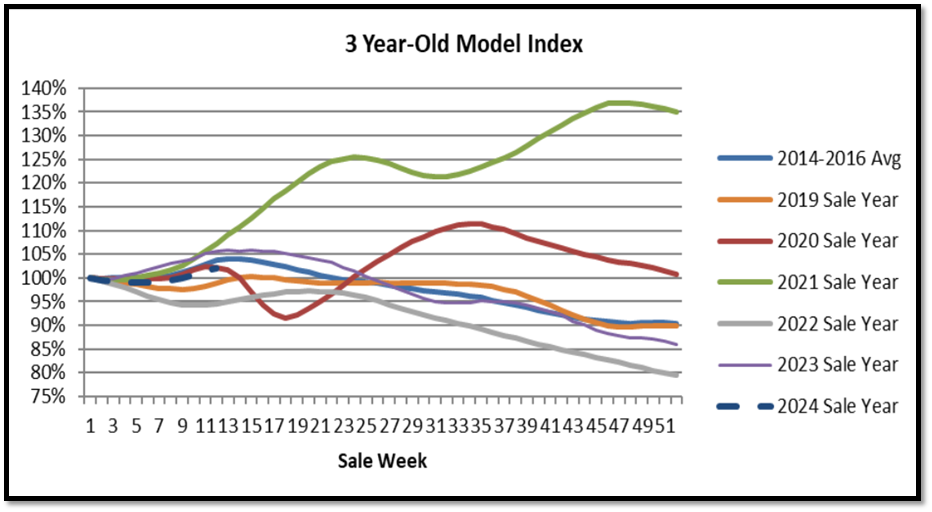
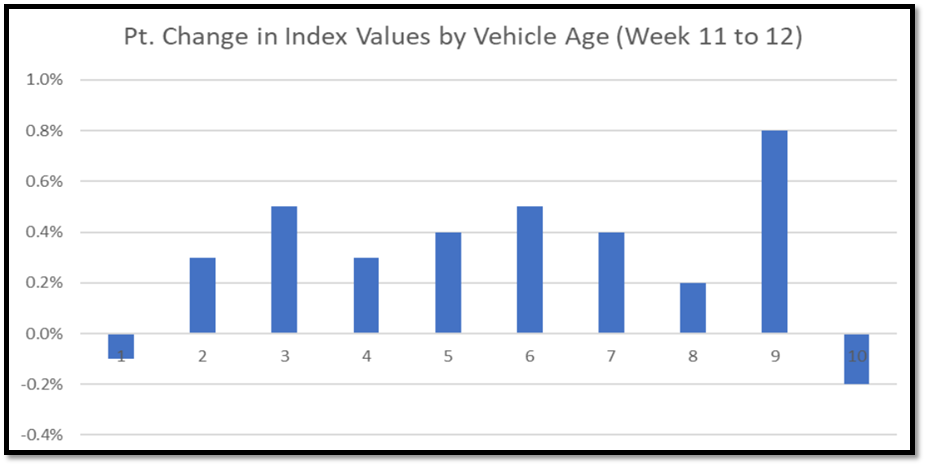
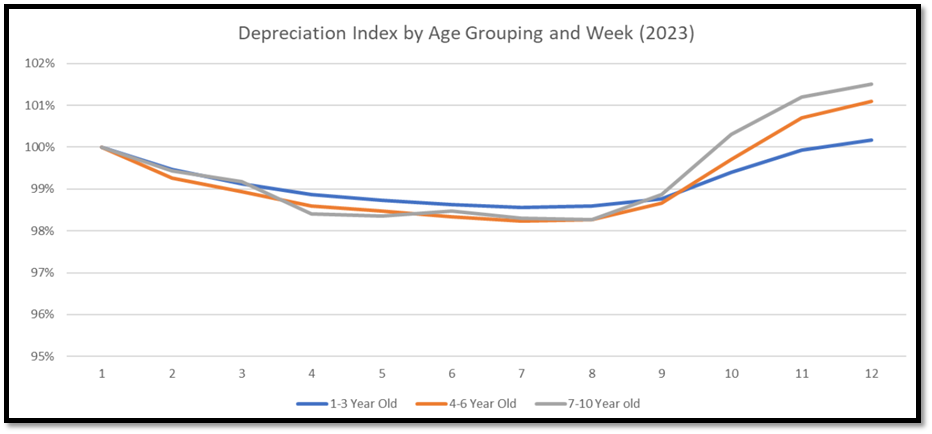
Shown below, luxury and non-luxury index values continue to increase week over week but slowing between week 11 and week 12 after having a significant increase between weeks 9 and 11. Also, below that you see the depreciation index by age is inverted this week again signaling appreciation in the used car market which impacts aging inventory value on dealers’ lots. However, you can see a softening of that appreciation which is where we need to be predictive and cautious over the next few weeks to keep pace with our turn and sales rate.
Manheim Wholesales to Retail Trending: Source
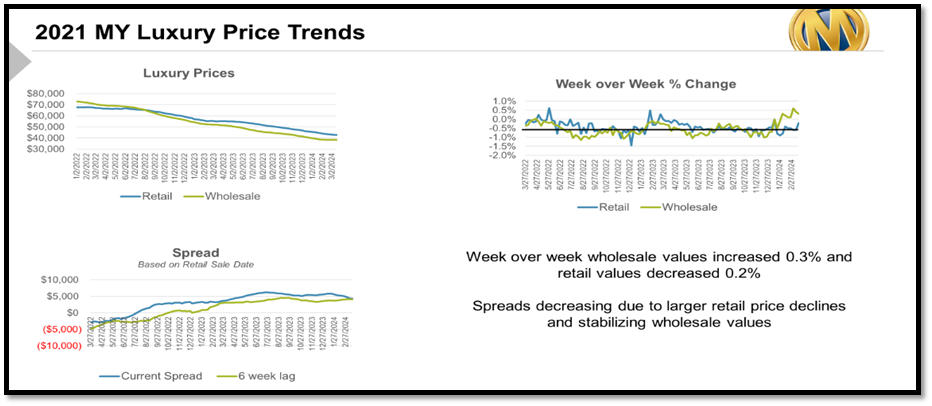
The below graph shows luxury and non-luxury margin compression spreads are tighter than they’ve been 2022 and only getting tighter. Dealers focusing on process and expense control can grow departmental gross in this market but focusing to heavily on front gross can cause big losses in many cases.
Summary: Source
According to Cox Automotive, leads are down y/y in March on both Autotrader and Kelley Blue Book, but leads are up for the month compared to February on both sites. Unique leads per dealer are down y/y in March for new and used vehicles, but new leads are up for the month compared to February on websites hosted by Dealer.com. Unique credit applications per dealer on Dealertrack were up 19% y/y last week as applications per dealer saw an improving trend. Service trends on Xtime relative to last year improved last week as completed appointments were down 1% y/y.